Schedule Strain in Challenger Tennis Opens Doors for Informed Wagers
Rosa Sullivan · Aug 20, 2026
Schedule Strain in Challenger Tennis Opens Doors for Informed Wagers
Challenger circuit events pack multiple matches into short windows across the summer months, and data from the ATP Challenger Tour shows how repeated fixtures affect player performance metrics in measurable ways. Observers note that athletes often travel between venues with minimal recovery time, which influences serve percentages, unforced error rates, and match duration statistics. Research from sports science institutions indicates that consecutive matches without adequate rest periods correlate with declines in first-serve accuracy and baseline endurance.
Understanding Congestion Patterns on the Circuit
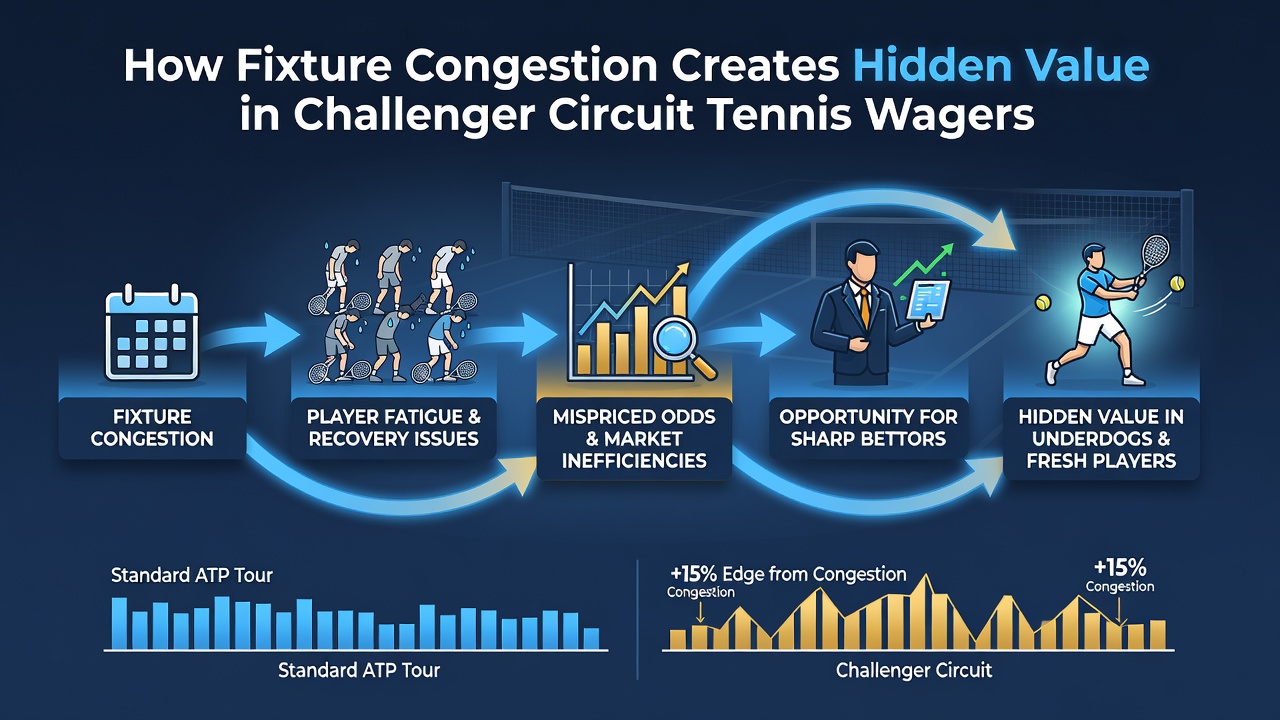
Challenger tournaments cluster during the European and North American summer hard-court swing, creating sequences where players compete in back-to-back weeks. Figures from tournament organizers reveal that many competitors enter three or more events within a 14-day span, especially in August 2026 when the calendar accelerates ahead of late-season qualifiers. Those patterns produce fatigue that appears in betting markets through shifts in implied probabilities for straight-set victories and total games played.
Analysts track how players who advance deep in one event then face shorter preparation periods for the next draw. Data compiled across multiple seasons demonstrates that recovery windows under 48 hours coincide with elevated rates of early-round exits for higher-ranked entrants. This information surfaces value when markets price favorites without fully adjusting for documented workload spikes.
Travel and Recovery Factors in 2026 Events
Geographic clustering of tournaments forces rapid transitions between time zones and surfaces, and studies published by the International Tennis Federation highlight how cumulative travel distances impact neuromuscular function. In August 2026, events in North America and Europe overlap in ways that compress schedules further, leaving limited opportunities for acclimatization. Market makers adjust odds based on historical averages, yet granular performance logs show deviations that persist across similar fixture blocks.

Physical preparation staff monitor heart-rate variability and sleep metrics during these stretches, with findings indicating slower return to baseline after three matches in five days. Bettors who review these indicators alongside official entry lists identify instances where listed favorites carry elevated risk compared to their quoted prices. External reports from academic centers such as the University of Queensland sports research group document parallel effects in elite cohorts facing dense calendars.
Market Reactions and Observable Edges
Betting exchanges and traditional bookmakers incorporate surface and ranking data into models, yet congestion effects often remain partially priced until live trading begins. Historical datasets from the 2024-2025 seasons demonstrate that underdogs win a higher share of deciding sets when both competitors arrive with similar recent match counts above a defined threshold. Observers tracking these thresholds find consistent discrepancies between pre-match odds and realized outcomes in mid-tier events.
Qualifying rounds add another layer, as successful qualifiers frequently carry momentum from earlier wins while main-draw seeds manage residual fatigue. Tournament records from 2026 events show that players exiting qualifiers after three wins post win rates above their season averages when facing tired seeds in round one. This pattern repeats across venues where the draw size and prize money attract dense fields without extended rest protocols.
Case Examples from Recent Circuits
One documented sequence in the 2025 North American swing featured multiple players reaching semifinals across consecutive weeks, after which their next-event results deviated from ranking-based expectations. Similar clusters appear in the 2026 calendar during the same period, where overlapping entry deadlines limit withdrawal flexibility. Those who monitor official withdrawal lists and practice reports identify opportunities when public perception lags behind updated workload data.
Industry analyses from bodies such as the Tennis Canada performance research division quantify how schedule density influences point-construction efficiency, offering supplementary context for model refinement. These reports align with observed market movements in sets decided by narrow margins.
Conclusion
Challenger circuit congestion generates measurable shifts in performance variables that appear in betting outcomes when examined through workload and recovery lenses. Tournament calendars in August 2026 continue to produce these conditions across multiple regions, supplying fresh datasets for ongoing analysis. Market participants who integrate scheduling records with performance metrics locate discrepancies that persist across repeated fixture blocks.